Operations & Health
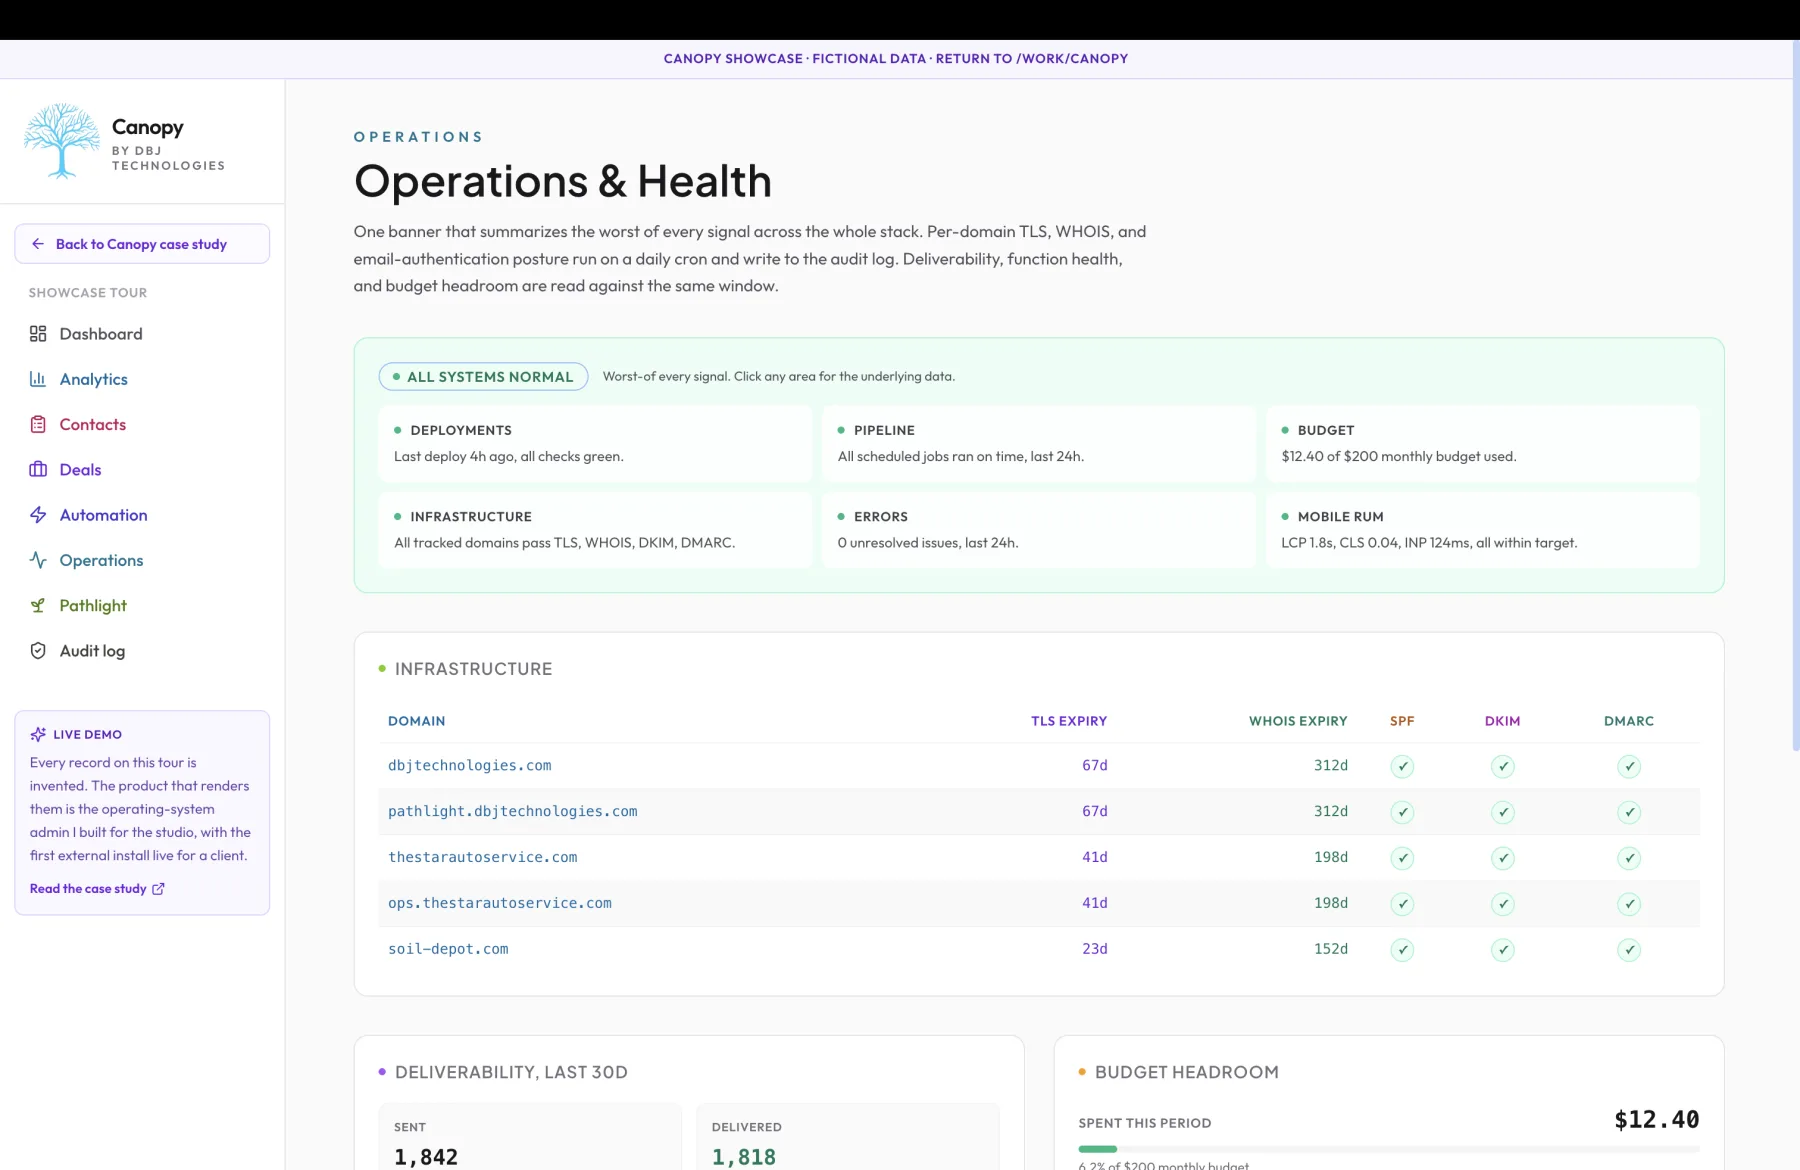
One banner that summarizes the worst signal across the whole stack, daily cron checks for the slow-moving infrastructure questions, real-time ingest for the fast-moving deliverability and error signals. Why I built around the inverse discipline of staying quiet until something matters.
The question that shaped the operations surface: what does an operator actually need to see, and what is just dashboard porn. Most operations dashboards try to show everything. Five graphs across the top, twelve gauges down the side, a dozen widgets below that, all updating in real time, all colored to attract attention. The operator either trains themselves to ignore the page or they panic-respond to whichever gauge happens to be yellow at the moment they happen to look. Neither outcome ships meaningful work. Both outcomes look responsible to a stakeholder who does not have to live with the dashboard, and that is the only audience the everything-dashboard is actually built for. Canopy's operations surface follows the opposite posture from the everything-dashboard. The default state is one banner at the top of the page that summarizes the worst signal across the entire stack. Green means everything I bother to monitor is fine. Amber means something needs attention this week. Red means something needs attention right now. The operator visits the page for the work they came to do, and the operations surface only speaks up when there is something they actually have to act on. Silence is the success condition. The decision to make the banner the surface and the dashboard the drill-down was deliberate. A buyer who sees the banner amber in the morning has one question, which is 'what do I have to do about it,' and the drill-down has to answer that question in one click. The banner is therefore not a status bar; it is a router. Click the banner and the relevant subsystem opens with the underlying data and the recommended action. Per-domain TLS expiry, WHOIS expiration, email-authentication posture, deployment health, deliverability rollups, function-level error volume, real-time spend against the configured budget ceilings, all behind the same banner-shaped entry point. I considered always-on real-time alerting that paged the operator on every threshold crossing. I rejected it for the reason most alerting layers eventually fail: most small businesses get three alerts and then mute the channel, and a muted channel is worse than no channel because it manufactures false confidence. The buyer thinks they are covered because the alerting tool is wired up; the alerting tool is firing into a channel nobody reads. The right design is the inverse: the operations surface speaks rarely and authoritatively, and the operator trusts that silence means OK. Trust requires that silence be earned through low false-positive rates and high true-positive recall, and the architecture is tuned for both. Daily cron is enough for everything I check at the operations layer where the underlying signal moves slowly. Certificate expiry moves on a 90-day cycle for the kinds of certificates Canopy installs use, which means a daily check has eighty-nine days of warning before any cert can fail. WHOIS expiration moves on a similar timeline. Email authentication posture moves only when DNS records change, which is rare. The daily cron writes its findings to the audit log at the same time it updates the banner, so the trail is durable and the question 'when did this start failing' is answerable from the audit log without consulting the cron's own logs. The minute-to-minute signals are a separate path that does need real-time ingest. Three of those genuinely change inside an hour and would be useless on a daily cycle. Deployment health is the first: a deploy that fails has to surface in the operations banner immediately, not eight hours later when the next daily cron runs. Email deliverability is the second: a sender domain whose authentication has been flagged by a major provider has to show up in the banner before the next campaign goes out. Function-level error volume is the third: a runtime error that started ten minutes ago and is still firing has to be visible in the same minute so the operator can decide whether to roll back. These signals get ingested as they happen, written to the same database the banner reads from, and the banner reflects them on the next page render. The infrastructure-health checks themselves are run daily per tracked domain. The buyer can configure which domains they want monitored, and each check is an independent query against the relevant external service. TLS validity is a probe against the domain's port 443 with certificate inspection. WHOIS expiration is a query against the domain registrar's WHOIS service. SPF validity is a DNS lookup with a rule check; same for DKIM and DMARC. Each check returns a status and a description, both of which write to the audit log alongside the check's timestamp. If a check fails, the banner reflects the failure on the next render. If a check succeeds for the first time after a previous failure, the banner clears and the audit log holds the clear event for posterity. Deliverability ingests from the buyer's transactional email provider through an authenticated integration. The ingest captures send events, delivery events, bounce events, and complaint events, and the operations surface aggregates these into the banner-level signal that the buyer's outbound is healthy. A spike in bounces relative to the rolling baseline triggers an amber banner; a spike in complaints triggers red. The operator can drill into the deliverability page from the banner and see the per-recipient detail, the affected sender domain, and the recommended action. Function-level error volume comes from the runtime's error reporting integration. Canopy is deployed to a runtime that captures unhandled errors and reports them with stack traces and request context. The operations layer ingests these reports, dedupes them by error signature, and surfaces the top errors in the dashboard. A new error type that has fired in the last hour is visible in the banner as amber; a sustained error that is affecting many requests is red. The drill-down from the banner shows the per-error detail, the affected paths, and the link to the runtime's own error tracker for deeper investigation. Budget headroom is monitored in real time against the buyer's configured monthly cap for per-call integration spend. The cap is the same one the Pathlight integration enforces atomically, and the operations banner reads the current period's usage and displays the percentage remaining. When the usage crosses eighty percent of the cap, the banner reflects amber; at ninety-five percent, red. The drill-down shows the per-action history of what spent the budget and the period reset date. The operator can also adjust the cap from the same surface, with the change writing to the audit log. The failure mode I built against most carefully is the one most operations surfaces miss: a TLS certificate expiring at two in the morning. The operator is asleep. The certificate stops being valid at the moment of expiration. Every visitor to the site between then and the operator waking up sees a certificate error and bounces. Even if the certificate is renewed within an hour of the operator waking up, the marketing damage is done. The right defense is not to alert at the moment of expiration; it is to surface the upcoming expiration days before. Canopy's daily cron flags any certificate within thirty days of expiry as amber and any within seven days as red. The buyer is warned during working hours, when warnings can become tickets instead of incidents. The honest exclusion: this operations surface is not a substitute for a dedicated infrastructure-monitoring tool at scale. A buyer running a high-traffic consumer site with many points of failure across many providers needs a more sophisticated monitoring stack with alerting fan-out, on-call rotation, and incident runbooks. Canopy's operations layer is built for small businesses where the operator is also the on-call engineer, where the failure modes are well-bounded, and where the discipline of staying quiet is more valuable than the depth of an alerting matrix. The architecture's exclusions are deliberate. The operational consequence the buyer feels is trust. Operations is not a dashboard you visit in panic when something has broken; it is a banner you trust because it stays quiet when it should and speaks up only when you have to act. The drill-down is there when you need it; the banner does the daily work.